
Introduction
Most call center dashboards show thirty or forty numbers at once, and almost none of them change what a supervisor does that day. Call center metrics only earn their place on a screen when they point at a real decision, not when they simply look impressive in a weekly slide deck. The gap between a busy dashboard and a useful one usually comes down to picking fewer numbers and reading them properly.
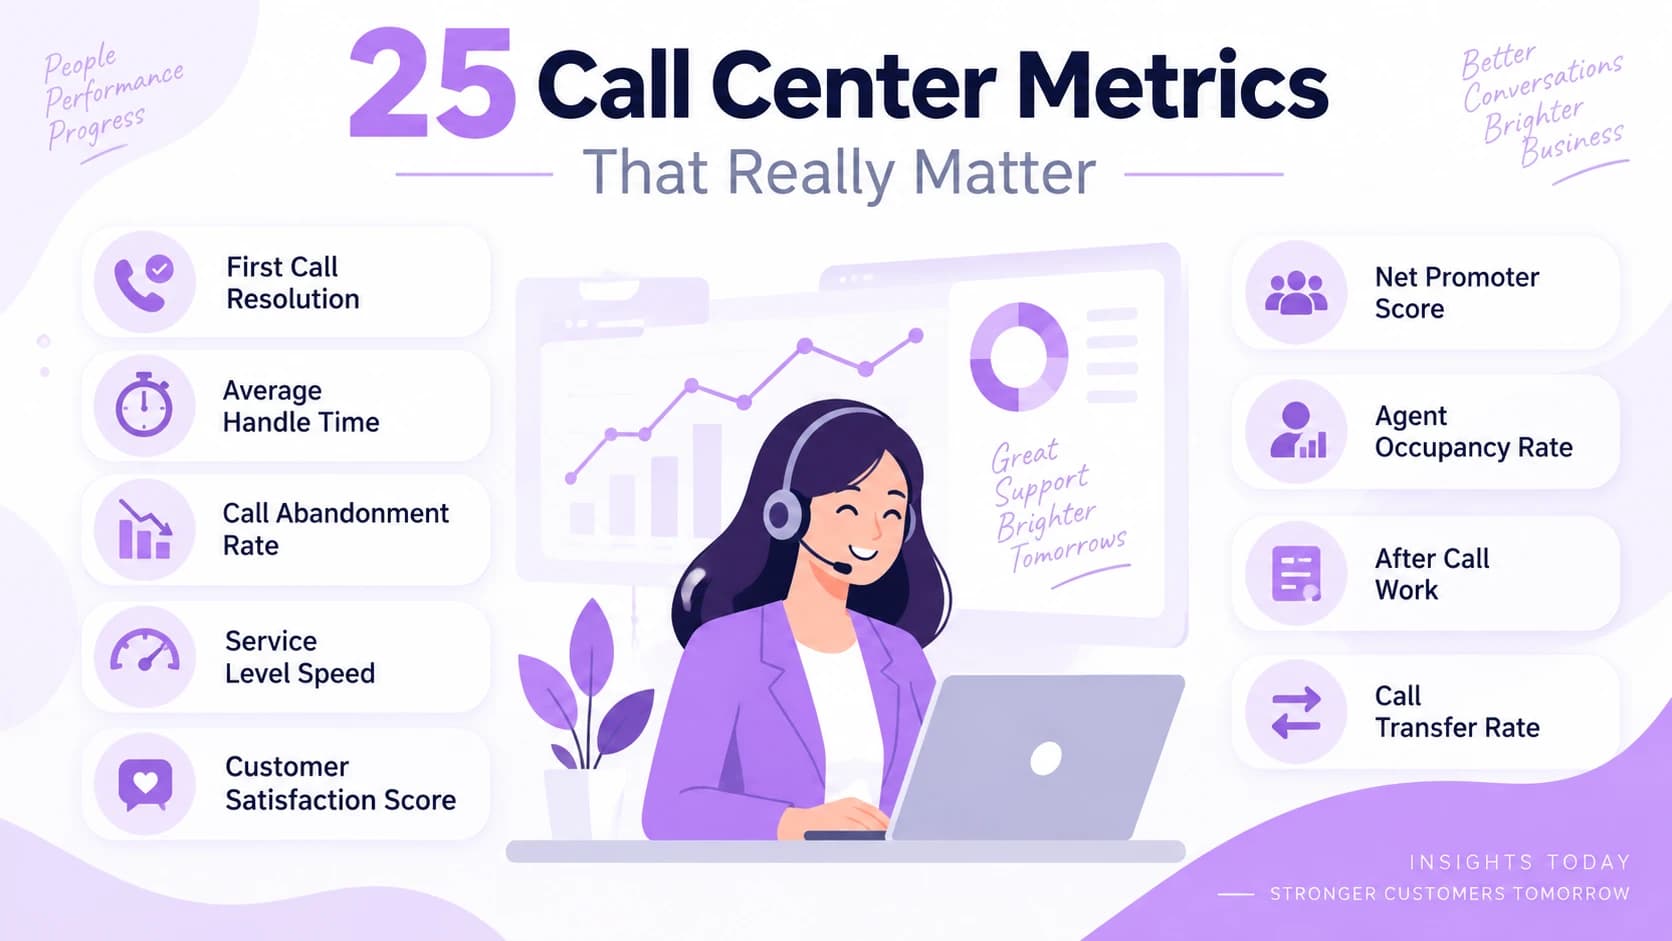
This guide explains why the right call center metrics matter, breaks down the ones worth tracking across customers, agents, and efficiency, and shows which popular numbers deserve to be dropped. It also covers how to set fair benchmarks and how to watch these metrics live instead of in a weekly report. By the end, you will know exactly which five or six numbers actually deserve your attention.
Why the Right Call Center Metrics Matter
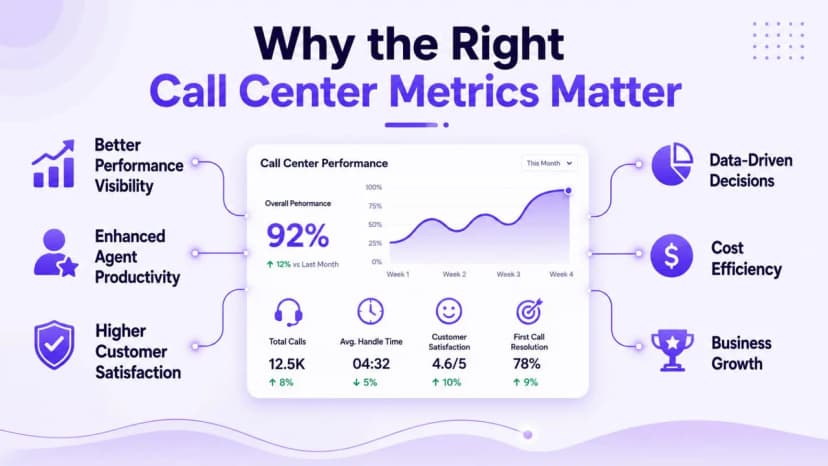
A number only earns a spot on a dashboard if it changes a decision. Call volume without an outcome, or login time without a result, is activity, not insight. The right call center metrics point straight at cost, quality, and how customers actually feel, while the wrong ones just fill space and slow down meetings that should take minutes.
Good metrics share three traits worth checking for: they tie to a real goal, they carry a clear target, and someone specific owns them. A number with no owner and no benchmark is decoration, no matter how often it gets mentioned. Teams that keep a short, owned list tend to react faster and argue less about what needs fixing next.
- A useful metric ties directly to a business goal, not just activity
- Every metric worth keeping has a clear numeric target attached to it
- Someone specific should own each metric and act when it slips
- Pair every raw number with a trend, not just a single snapshot
- A 3-minute handle time can be great or bad depending on the call type
- Metrics without an owner tend to get reported but never acted on
- Write down the action each metric should trigger before you start tracking it
- A short, shared scoreboard beats a long report nobody fully reads
Customer Experience Metrics Worth Tracking
These numbers show how customers actually feel about each interaction, and they tend to matter most to leadership. First Call Resolution measures the share of issues solved on the first contact, with a target of 70 to 75 percent or higher. Customer Satisfaction, gathered right after a call, should sit around 85 percent or better on a well-run team.
Net Promoter Score tracks how likely a customer is to recommend you, and anything above 30 is considered solid. Customer Effort Score captures how hard it was to get help, where lower is always better. Average Speed of Answer and Call Abandonment Rate round out the picture, showing how long people wait and how many give up before an agent picks up.
- First Call Resolution: issues solved on the first contact, targeting 70 to 75 percent
- Customer Satisfaction: a post-call rating of the experience, aiming for 85 percent or higher
- Net Promoter Score: how likely a customer is to recommend you, with 30 or above considered solid
- Customer Effort Score: how hard it was to get help, where a lower score is better
- Average Speed of Answer: how long callers wait, targeting under 28 seconds
- Call Abandonment Rate: the share who hang up before reaching anyone, kept under 5 percent
- Repeat Call Rate: how often the same issue triggers another call, a quiet honesty check
- Sentiment Score: an AI-scored read of tone across the call, rising as service improves
Agent Performance Metrics Worth Tracking
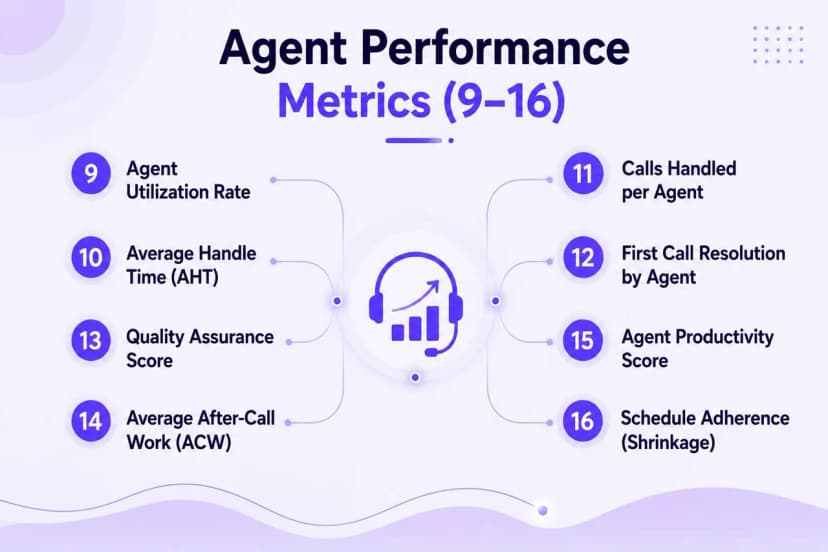
These numbers show how your people are doing without turning the floor into a stopwatch exercise. Average Handle Time covers the full call including hold and wrap-up, and the goal is balancing speed against quality rather than chasing the lowest number possible. After-Call Work tracks the notes agents write once a call ends, and automation can shrink this significantly.
Occupancy Rate shows the share of logged-in time agents actually spend on calls, with 75 to 85 percent as a healthy range. Schedule Adherence checks how closely agents follow planned shifts, targeting 90 percent or higher. Quality Score and Agent Attrition round things out, since a scored review of call handling and a rising churn number both quietly shape every other metric on this list.
- Average Handle Time: total time per call including hold and wrap-up
- After-Call Work: time spent on notes once the call ends, often shrunk by automation
- Occupancy Rate: the share of logged-in time spent on calls, targeting 75 to 85 percent
- Schedule Adherence: how closely agents follow their planned shifts, targeting 90 percent or higher
- Agent Utilization: productive time against total paid time, watching for burnout above 90 percent
- Quality Score: a scored review of call handling against a shared rubric
- Transfer Rate: how often a call moves to another agent, flagging routing or training gaps
- Agent Attrition: how often agents leave, since rising churn quietly wrecks other numbers too
Operational Efficiency Metrics Worth Tracking
These numbers connect service quality to real cost and staffing decisions. Service Level measures the percent of calls answered within a target time, often expressed as an 80/20 rule, and it works as the north star for staffing. Cost Per Contact divides total cost by contacts handled, giving the cleanest single efficiency number a team can track.
Average Time in Queue ties directly to abandonment, since longer waits push more callers to hang up. Forecast Accuracy shows how close volume predictions land, sharpening staffing decisions week over week. IVR containment rates reveal how much volume self-service resolves before it ever reaches an agent, freeing capacity for harder conversations.
- Service Level: the percent of calls answered within a target time, often 80/20
- Contact Volume: total calls and messages over a period, the base for every forecast
- Cost Per Contact: total cost divided by contacts handled, the clearest efficiency number
- Average Time in Queue: how long callers wait in line, tied directly to abandonment
- Forecast Accuracy: how close volume predictions land, sharpening staffing week over week
- IVR Containment: the share of contacts self-service resolves without an agent
- Channel Mix: the split across phone, chat, email, and social, guiding where to invest
Which Call Center Metrics to Ignore
Most metric lists just keep adding numbers, which buries the ones that actually count. The real skill for 2026 is subtraction, not addition, and cutting vanity metrics is how strong teams stay focused on what moves the business. Raw call volume alone tells you nothing about quality or cost, and total talk time without an outcome is just activity.
Login counts and raw email totals fall in the same bucket, since they measure effort rather than value delivered. Any number nobody acts on is a fair candidate to retire this quarter. Teams that lean on AI in call centers can auto-score sentiment and quality across every interaction, which replaces several manual vanity counts at once.
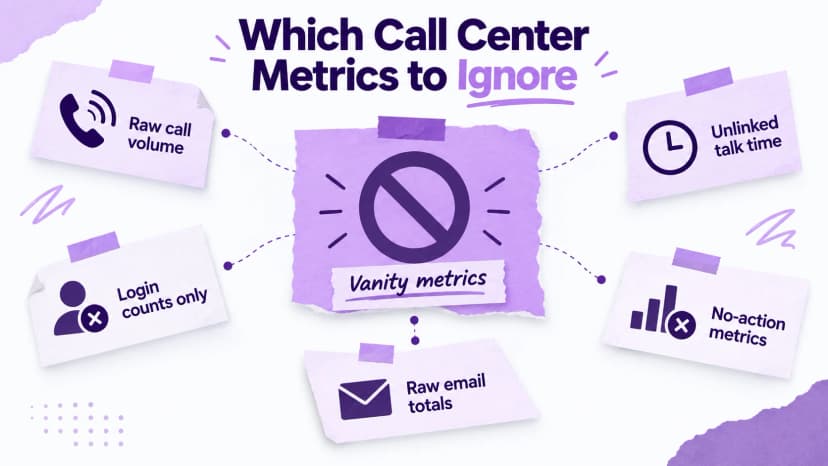
- Raw call volume alone, with no context on quality or outcome
- Total talk time that is not tied to an actual resolution
- Login counts that measure presence rather than useful work
- Raw email or chat totals with no outcome attached to them
- Any metric that has never once changed a decision this year
- Vanity dashboards built to impress rather than to guide action
- Numbers tracked purely because a past manager once asked for them
Setting Fair Call Center Benchmarks
Published industry figures give a useful starting point, but your own history usually matters more than an outside average. Set a baseline from last quarter's real numbers, then aim for steady, realistic gains instead of chasing a perfect score overnight. A team that improves 5 percent every quarter beats one that sets an unrealistic target and quietly gives up on it.
Regulation shapes some benchmarks too, not just internal preference. For outbound calling, the FCC abandoned call rule caps call abandonment at 3 percent per campaign, which is a stricter ceiling than many internal targets use. Building that rule into your own benchmark keeps a call center both compliant and genuinely customer-friendly.
How to Track Call Center Metrics in Real Time
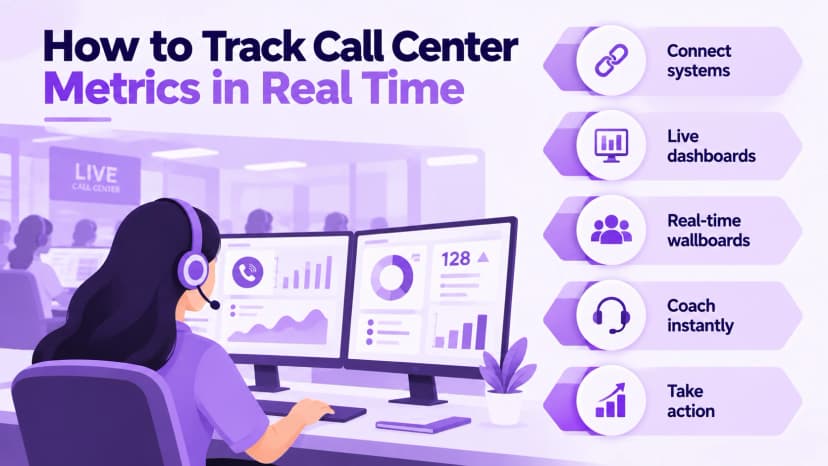
Weekly spreadsheets are simply too slow for a busy floor, since a bad trend can run for days before anyone actually notices it. Live dashboards let supervisors coach in the moment instead of days later, when the pattern has already cost real calls. Connecting your phone system, CRM, and quality tools into one view is what makes this possible.
Ringflow ties calling, routing, and analytics together, so metrics update as calls happen rather than at the end of a shift. Live wallboards put the same numbers on a screen the whole floor can see, nudging behavior without a single extra meeting. Supervisors can step into a call the moment a metric slips, turning a lagging number into a conversation that actually gets saved.
Conclusion
The best call center metrics are the ones that actually get used to make a decision, not the ones that simply fill a report nobody rereads. Focus on a tight set across customer, agent, and efficiency lenses, and pair every number with a clear, honest target. Read them together, and problems become visible while there is still time to fix them properly.
Stop tracking everything and start tracking what actually changes behavior on the floor. Pick five numbers, set fair benchmarks from your own history, and review them live instead of once a week in a meeting. Ringflow puts those numbers on one dashboard, updated as each call ends, so your team reacts to what is happening now.
Ready when you are
Ready to see your most important call center metrics update live as calls happen?
Test Ringflow, connect your data, and turn scattered stats into one clear, real-time scoreboard.
Frequently Asked Questions
First Call Resolution, Customer Satisfaction, Service Level, Average Handle Time, and Cost Per Contact together cover quality, speed, and cost in one glance.
Start with about five, spread across customer, agent, and efficiency categories. Tracking all twenty-five at once slows decisions instead of sharpening them.
They come from your phone system, CRM, and quality tools, pulled into one dashboard. Modern platforms calculate most of these numbers automatically as calls happen.
Drop raw call volume, total talk time with no outcome, and any number nobody has acted on this year. Vanity metrics crowd out the few that matter.
For outbound telemarketing calls, the FCC's abandoned call rule caps abandonment at 3 percent per campaign, stricter than many internal customer service targets.