
Introduction
A UCaaS platform can run perfectly on paper and still quietly fail a business. Licenses sit unused, call quality slips on certain routes, and nobody notices until a customer complains or a renewal comes up for review. UCaaS analytics is the only reliable way to catch that kind of drift early, before it costs real money or a renewal you were counting on.
This guide covers what UCaaS analytics actually means, the four categories of metrics worth tracking, and what call quality scores like MOS measure under the hood. It also explains how adoption data exposes tools nobody uses, what a good dashboard looks like, and why reporting is shifting from monthly summaries to real-time alerts. By the end, you will know exactly which numbers deserve your attention.
What Is UCaaS Analytics, Exactly?
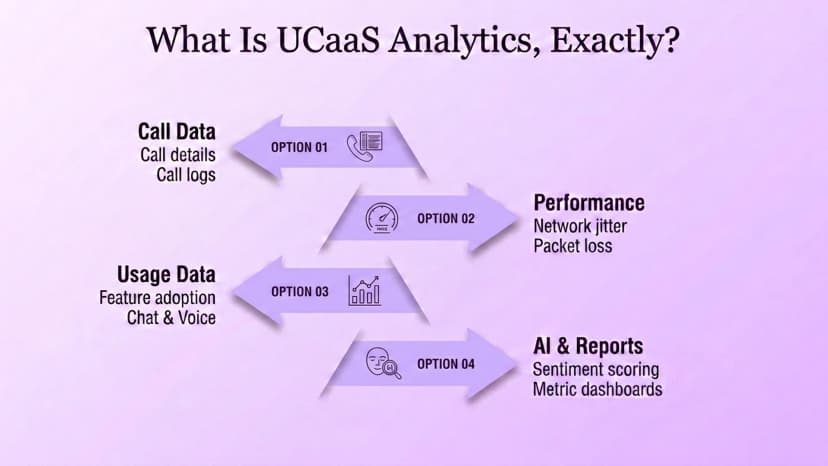
UCaaS analytics is the reporting layer built into a Unified Communications as a Service platform, and it is broader than a call log or a monthly phone bill. It combines call detail records, network data such as jitter and packet loss, and feature usage patterns into one connected picture instead of three separate exports nobody has time to reconcile.
A call log tells you a call happened. Analytics tells you whether it sounded good, whether the feature involved is used anywhere else in the company, and whether the trend behind it is getting better or worse over time. More platforms now layer AI insights, like sentiment scoring and automated summaries, on top of that same raw call and network data.
- Combines call detail records, network data, and feature usage into one picture
- Tracks jitter and packet loss alongside who is actually using each feature
- Turns raw call activity into dashboards a manager can act on
- Increasingly includes AI insights such as sentiment scoring on live calls
- Shows whether a trend is improving or getting worse over time
- Covers voice, video, and chat rather than phone calls alone
- Works across departments and locations, not just a single office
- Reveals patterns a business would otherwise only notice by chance
- Pulls data from every connected device, not just desk phones alone
The Four Categories of UCaaS Metrics That Matter
Most UC metrics fall into one of four broad categories, and each one answers a different question about the platform. Quality metrics, such as MOS, jitter, packet loss, and latency, are the technical measures of whether calls actually sound good. Adoption metrics track who is using which features, how often, and in what context, broken down across departments and office locations.
Productivity metrics cover first call resolution, average handling time, and response times, the same measures a contact center already tracks closely. Collaboration effectiveness rounds out the list, covering meeting attendance, messaging usage, and how teams actually use video and chat day to day. A contact center leans heavily on the first two categories, while a collaboration-heavy office cares more about the last two.
- Quality: MOS, jitter, packet loss, and latency define whether calls sound clear
- Adoption: which features get used, by whom, and how consistently
- Productivity: first call resolution, handling time, and response speed
- Collaboration effectiveness: meeting attendance and day-to-day chat and video use
- Contact centers weigh quality and productivity metrics most heavily
- Collaboration-first offices weigh adoption and effectiveness metrics more
- Raw call quality matters less if a feature barely gets used at all
- UCaaS analytics dashboards usually organize reporting around some version of these four groups
- Weighting the four categories correctly depends on how the business actually operates
What Do Call Quality Metrics Like MOS Actually Measure?
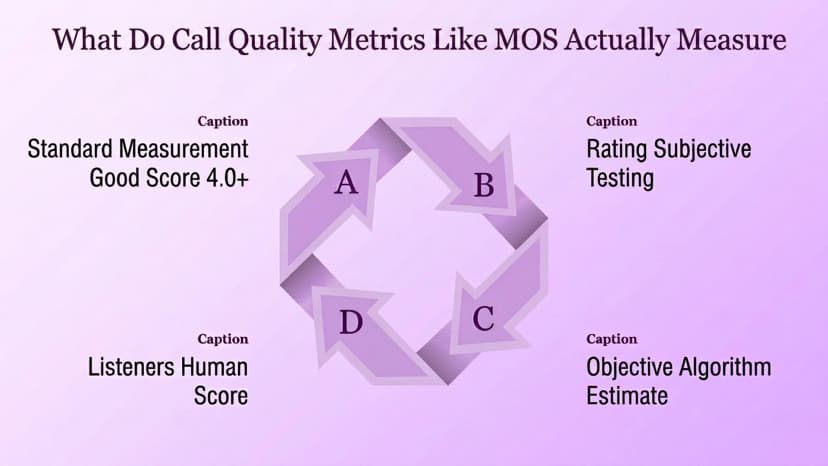
Mean Opinion Score, or MOS, is the standard measure of how a call actually sounds, running on a 1.0 to 5.0 scale where 4.0 or higher is generally considered good. It comes from two distinct methods: subjective testing, where groups of trained human listeners rate real call samples by ear, and objective testing, where algorithms estimate quality directly from network metrics.
Three network metrics feed that score directly. Jitter is uneven packet timing that makes a voice sound choppy or robotic. Packet loss is the share of data that never arrives, creating audible gaps. For a deeper, practical breakdown of how these three metrics interact together in real calls, see this guide to VoIP call quality, which covers the same three metrics from the troubleshooting side.
- MOS runs on a 1.0 to 5.0 scale, with 4.0 or higher considered good
- Subjective testing uses real human listeners rating actual call samples
- Objective testing estimates quality automatically from network metrics
- Jitter is uneven packet timing that makes voices sound choppy
- Packet loss is missing data that creates audible gaps or dropouts
- Latency, or round-trip time, causes people to talk over each other
- In UCaaS analytics, a single low score is a symptom, not a full diagnosis
- Track MOS by location or route to catch problems a single average would hide
- Set alert thresholds below 4.0 so a drop gets flagged before customers complain
How Do Adoption and Productivity Analytics Show Real Usage?
Adoption analytics track which features employees actually use, how often, and where, turning a vague sense of value into an honest answer. Which departments lean on video conferencing, and which barely touch it? Which offices still default to voicemail instead of chat? A business that never checks this data cannot know whether it is paying every month for licenses that nobody on staff ever opens.
Productivity metrics sit right alongside adoption data, and they borrow heavily from call center metrics like first call resolution and average handling time. Together, the two data sets answer a harder question than usage alone can answer: not just whether a feature gets touched occasionally, but whether it actually makes people faster at their jobs day to day.
- Adoption data reveals which departments actually use each feature
- Unused licenses are a common and costly blind spot after a rushed rollout
- Productivity metrics borrow directly from familiar call center benchmarks
- First call resolution shows whether one conversation solves the issue
- Average handling time flags calls that run longer than they should
- Response time gaps often point to a routing or staffing problem
- Good UCaaS analytics combine adoption and productivity data to separate busy from effective
- Review both data sets together, not as two unrelated reports
- Share both reports with team leads, not only with the IT department
What Shows Up on a UCaaS Analytics Dashboard?
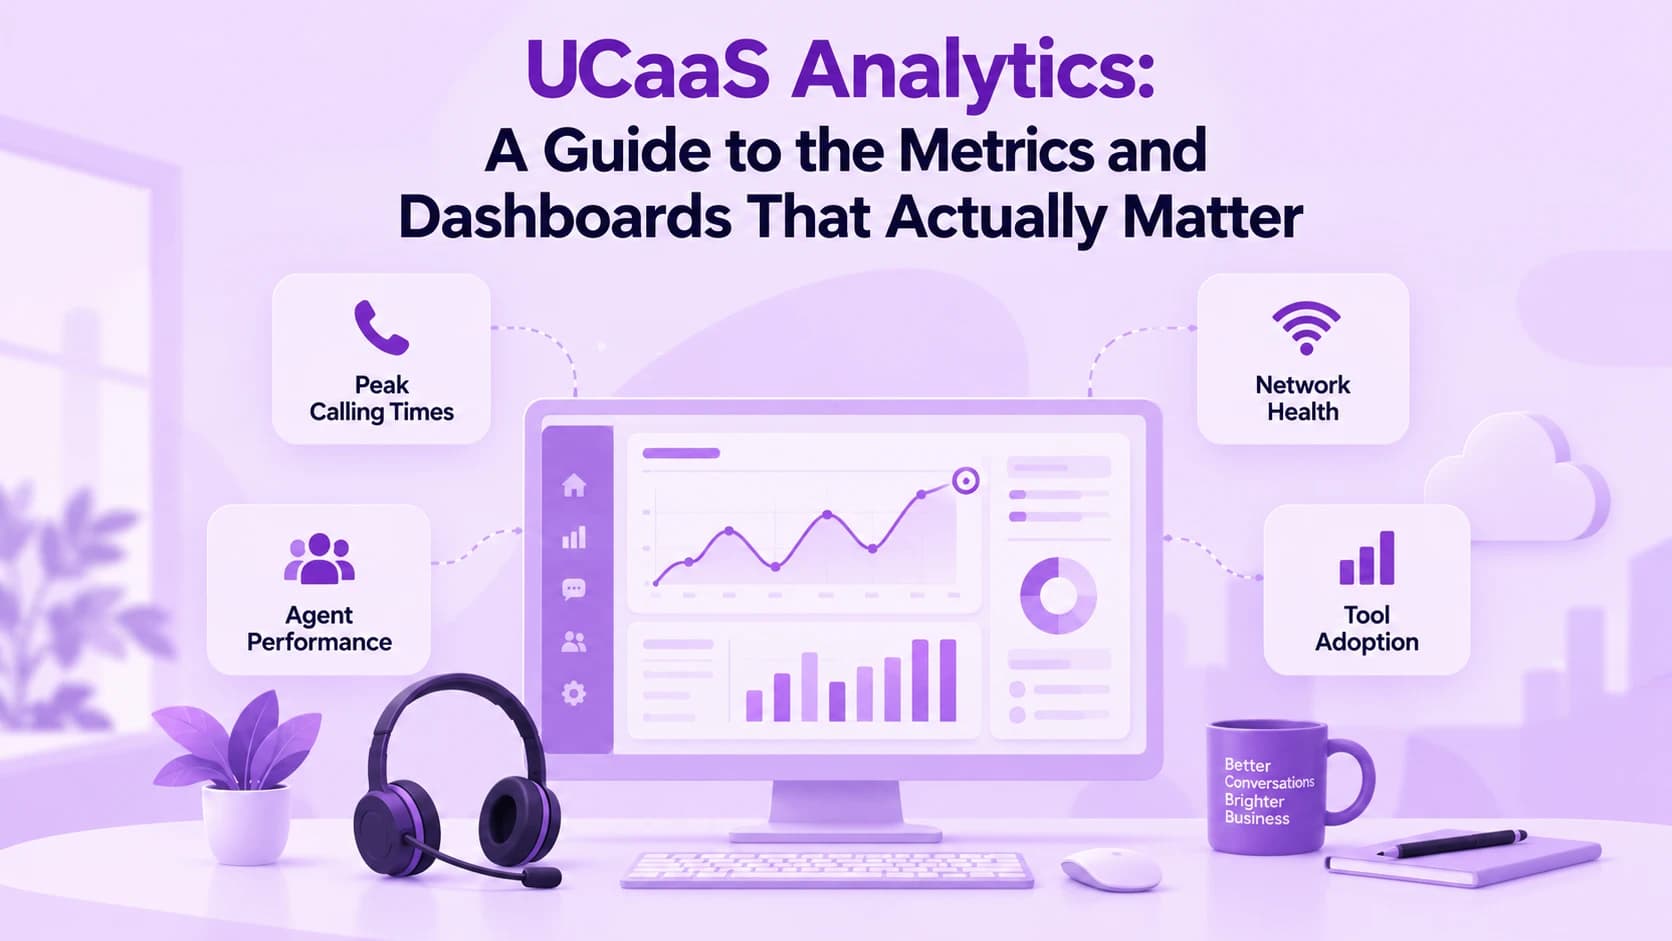
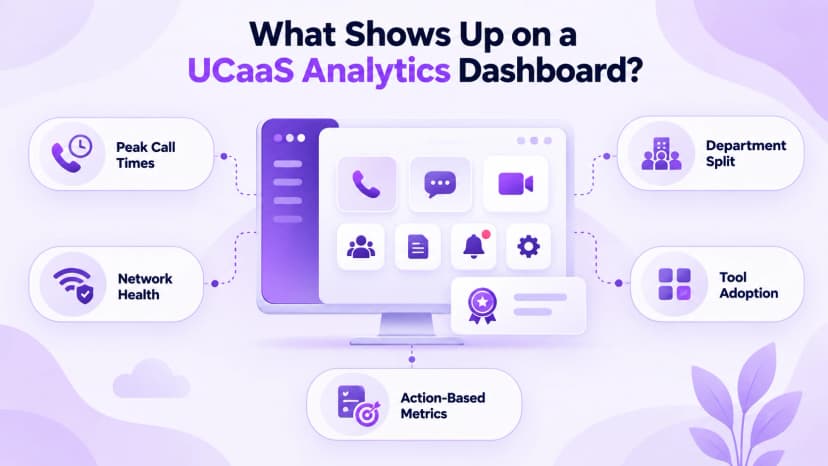
A well-built dashboard usually shows peak calling times, common customer issues, and agent or employee performance side by side. It also covers network health, conference room use, collaboration tool adoption, and, in a sales context, sales cycle benchmarks worth tracking over time. Splitting the data by location or department matters, since it reveals problems a company-wide average would otherwise hide.
The practical trap is collecting metrics nobody acts on. A dashboard full of numbers that never change a decision is just decoration. Keep every metric tied to a specific, repeatable action: a quality score should trigger a network check, a weak adoption number should trigger retraining, and a productivity metric should change how a team gets staffed.
- Peak calling times help staff schedules match actual demand
- Network health metrics catch quality problems before complaints arrive
- Splitting data by location or department reveals hidden problems
- Conference room and collaboration tool use rounds out the picture
- Every metric on the dashboard should map to a specific action
- A quality score drop should trigger an immediate network check
- A weak adoption number should trigger a retraining push, not a shrug
- Review the dashboard on a set schedule, not only when something breaks
- Assign one owner for the dashboard so metrics do not just sit unread
Why Are UCaaS Platforms Shifting to Real-Time Analytics?
Historical reporting only shows what already went wrong, and by the time it arrives, it is usually too late to fix anything for the person on that specific call. Real-time analytics flag a degrading call or a spike in hold times while they are still happening, so a team can step in during the interaction instead of reviewing it the next morning.
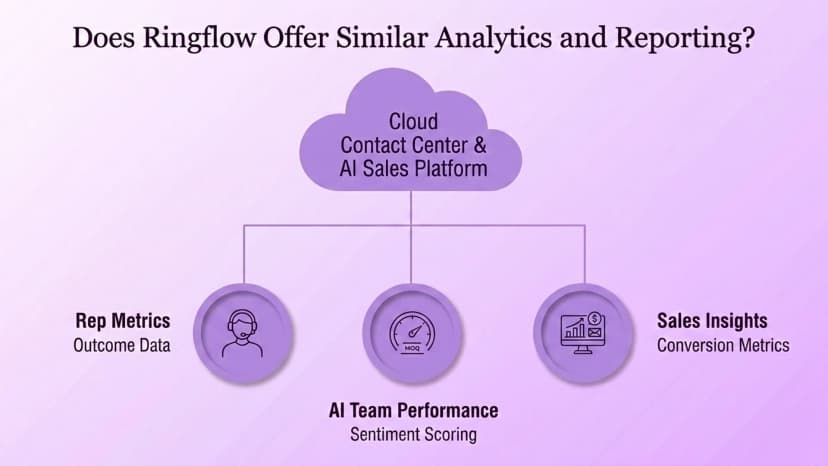
AI is speeding up that shift, with more platforms adding real-time transcription and predictive routing on top of live sentiment analysis. UCToday's metrics breakdown covers this shift in more depth. Ringflow's own reporting reflects that same direction, focused squarely on rep-level and team-level outcomes for customer-facing calls rather than company-wide network or collaboration monitoring.
- Real-time alerts catch a problem while the call is still happening
- Historical reports only confirm damage after the interaction already ended
- AI-driven transcription and routing are accelerating the shift industry-wide
- Live sentiment analysis flags frustration before a survey ever comes back
- Many businesses now add dedicated UC performance tools beyond one vendor's dashboard
- Ringflow's reporting centers on sales and customer-facing call outcomes
- A UCaaS platform's own dashboard still covers internal collaboration and network health
- Most teams end up running both types of reporting side by side
- Real-time alerts work best paired with a clear escalation plan already in place
Conclusion
The businesses getting real value out of UCaaS analytics are rarely the ones with the fullest dashboards. They track a small set of quality, adoption, and productivity metrics they actually act on, and they tie each one to a specific decision instead of letting it sit as decoration. That discipline matters more than the number of charts on the screen.
Start small: pick one metric from each of the four categories, decide what action each one should trigger, and build from there. Ringflow's Cloud Contact Center and AI Sales Platform can handle the sales and support side of that reporting, so your team spends less time reconciling three separate dashboards and more time actually acting on what each one shows.
Ready when you are
Want Sales and Support Analytics Built for Customer-Facing Calling?
See how Ringflow's Cloud Contact Center and AI Sales Platform tracks rep-level and team-level performance alongside your UCaaS platform's own reporting.
Frequently Asked Questions
It is the reporting layer inside a Unified Communications as a Service platform, tracking call quality, feature adoption, and usage patterns to show what is actually happening across a company's phone and collaboration tools.
Mean Opinion Score runs on a 1.0 to 5.0 scale, and a score of 4.0 or higher is generally considered good. Scores come from either human listener ratings or automated network-based estimates.
Quality, adoption, productivity, and collaboration effectiveness. Most dashboards organize their reporting around some version of these four groups.
Which features employees use, how often, and where, such as which departments rely on video conferencing and which still default to voicemail instead of chat.
Historical reports show problems only after they already happened. Real-time analytics flag a degrading call or a hold-time spike while it is still happening, giving a team a chance to fix it live.